There are many different types of meat, and they are typically classified as either red meat or white meat.
These two classifications of meat can differ substantially in their nutritional composition and their potential health effects.
In this article, we’ll look at examples of what qualifies as red and white meat, how they compare nutritionally, and what scientific research shows.
We’ll also explore the position of health authorities on red versus white meat and which option is healthier.
Table of contents
Examples of Red and White Meat
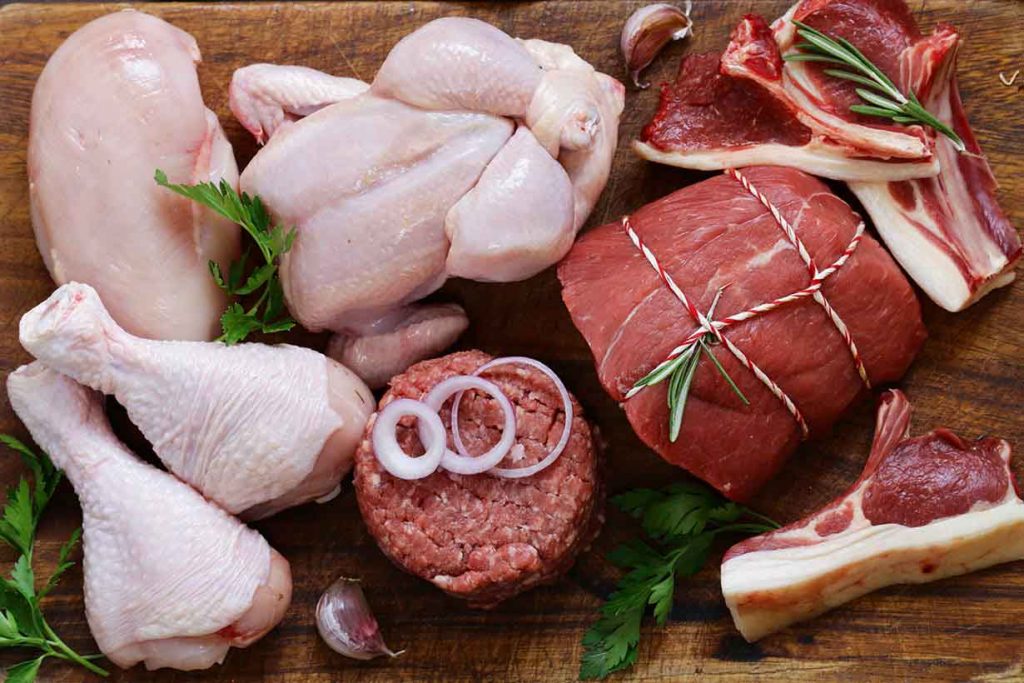
Before we begin the comparison, let’s first examine some examples of red and white meat, and how we can define each one.
Red Meat
Red meats typically have a red appearance in their raw state, defined by their high myoglobin content (1).
Myoglobin, a protein found in muscle tissue, has a red pigment. Many people mistake the combination of myoglobin and water in meat for blood.
The more myoglobin meat contains, the darker red it will appear.
Some examples of red meat include beef, bison, lamb, pork, venison, and certain organ meats.
White Meat
The term white meat is typically applied to poultry, although it is an oversimplification: some parts of a chicken (for example, the thigh) are darker because of higher myoglobin content.
However, the USDA defines red meat as any meat containing high enough levels of myoglobin to appear red, while white meat is lighter in color due to lower myoglobin levels (1).
Based on this definition, white meat includes chicken, duck, goose, and turkey.
How Do Red and White Meat Compare Nutritionally?
Let’s now compare the nutritional profiles of red and white meat using these four “ground” products:
- Ground beef (red)
- Ground lamb (red)
- Ground chicken (white)
- Ground turkey (white)
All nutritional data are from the USDA’s FoodData Central database and based on cooked weight per 100 grams (2, 3, 4, 5).
Calorie and Protein Content
- Ground beef: 211 kcal, 26.9 g protein
- Ground lamb: 281 kcal, 26.9 g protein
- Ground chicken: 201 kcal, 27.1 g protein
- Ground turkey: 211 kcal, 26.9 g protein
Note: These are typical values for ground beef based on USDA data, but there are many leaner ground beef options.
Learn more: Ground Beef: Nutrition Facts by Lean-to-Fat Ratio Comparison
Fat and Saturated Fat Content
- Ground beef: 11.5 g fat, 6.5 g saturated fat
- Ground lamb: 19.49 g fat, 8.06 g saturated fat
- Ground chicken: 10.3 g fat, 2.6 g saturated fat
- Ground turkey: 11.5 g fat, 2.9 g saturated fat
Here we can see one key difference: ground beef and pork have significantly higher saturated fat levels, whereas ground chicken and turkey contain only modest amounts.
Note: Lean red meat cuts contain significantly less saturated fat. See this guide to lean cuts of meat for more information.
Vitamin Composition
The following table shows how vitamin content compares between ground beef, lamb, chicken, and turkey (2, 3, 4, 5), presented as percent daily values (% DV) (6).
| Vitamin | Ground beef | Ground lamb | Ground chicken | Ground turkey |
|---|---|---|---|---|
| Choline | 15% DV | 18% DV | 14% DV | 14% DV |
| Folate, DFE | 3% DV | 5% DV | 2% DV | 2% DV |
| Thiamin (B1) | 4% DV | 8% DV | 6% DV | 7% DV |
| Riboflavin (B2) | 13% DV | 19% DV | 16% DV | 20% DV |
| Niacin (B3) | 32% DV | 42% DV | 54% DV | 50% DV |
| Vitamin B6 | 21% DV | 8% DV | 37% DV | 29% DV |
| Vitamin B12 | 113% DV | 108% DV | 55% DV | 78% DV |
| Vitamin A, RAE | 0% DV | 0% DV | 3% DV | 3% DV |
| Vitamin C | 0% DV | 0% DV | 0% DV | 0% DV |
| Vitamin D | 0% DV | 1% DV | 1% DV | 1% DV |
| Vitamin E | 1% DV | 1% DV | 1% DV | 1% DV |
| Vitamin K | 1% DV | 4% DV | 0% DV | 0% DV |
As shown, red meat typically has significantly higher amounts of vitamin B12 than white meat, whereas white meat contains more niacin.
Aside from this, both categories share a roughly similar vitamin profile.
Mineral Composition
Here is the mineral content of ground beef, lamb, chicken, and turkey, presented as percent daily values (% DV) (2, 3, 4, 5, 6).
| Mineral | Ground beef | Ground lamb | Ground chicken | Ground turkey |
|---|---|---|---|---|
| Calcium | 2% DV | 2% DV | 2% DV | 2% DV |
| Copper | 9% DV | 14% DV | 17% DV | 18% DV |
| Iron | 14% DV | 10% DV | 8% DV | 9% DV |
| Magnesium | 5% DV | 6% DV | 7% DV | 7% DV |
| Phosphorus | 15% DV | 16% DV | 20% DV | 21% DV |
| Potassium | 6% DV | 7% DV | 6% DV | 6% DV |
| Selenium | 39% DV | 50% DV | 56% DV | 51% DV |
| Sodium | 17% DV | 17% DV | 17% DV | 18% DV |
| Zinc | 56% DV | 42% DV | 28% DV | 34% DV |
Note: The sodium values appear high because the USDA entries for cooked ground meat include added salt to reflect typical preparation.
Red meat provides higher amounts of iron and zinc than white meat. In contrast, white meat typically contains slightly more copper, phosphorus, and selenium.
Bioactive Compounds
In addition to nutrients, meat contains various bioactive compounds that may have health benefits, including:
- Carnosine
- Coenzyme Q10
- Conjugated linoleic acid
- Creatine
- Glutathione
- L-Carnitine
- Taurine
The table below shows data from scientific studies on their typical concentrations in red and white meat.
| Compound | Red Meat | White Meat |
| Carnosine | 0.13–7.06 mg/g (7) | 0.66–7.9 mg/g (7) |
| Coenzyme Q10 | 16.1–36.5 mg/kg (8) | Low levels (8) |
| Conjugated linoleic acid | 4.3–19.0 mg/g fat (11) | Trace levels (11) |
| Creatine | 263–489 mg/100 g (12) | 89–163 mg/100 g (13, 14) |
| Glutathione | 12.3–23.3 mg/100 g (15) | 13.1 mg/100 g (15) |
| L-Carnitine | 139 mg/100 g (16) | 9.99–10.43 mg/100 g (16) |
| Taurine | 8–83.8 mg/100 g (17) | 5–436 mg/100 g (17) |
What Research Says About Red Meat vs. White Meat
There has been extensive scientific research investigating the health effects of red and white meat.
Below is a summary of some notable studies:
Association Between Red and Processed Meat Consumption and Colorectal Cancer Risk: A Comprehensive Meta-Analysis of Prospective Studies
- This 2025 meta-analysis analyzed data from 60 observational studies on red and processed meat and colorectal cancer risk (18).
- The authors found that red meat intake was associated with a 22% increased risk of colon cancer, a 15% increased risk of colorectal cancer, and a 22% higher risk of rectal cancer.
- Similar associations were observed for processed meat consumption.
White Meat Consumption and Risk of Cardiovascular Disease and Type 2 Diabetes: A Systematic Review and Meta-Analysis
- This 2023 study analyzed results from 23 observational studies and three randomized controlled trials (19).
- It investigated the effects of white meat consumption on cardiovascular disease and type 2 diabetes.
- No significant benefits or drawbacks of white meat were identified.
Association of Red Meat and Poultry Consumption With the Risk of Metabolic Syndrome: A Meta-Analysis of Prospective Cohort Studies
- This 2021 meta-analysis examined data from nine observational trials involving a total of 21,869 participants (20).
- Unprocessed red meat—such as beef, lamb, and pork—was associated with a 32% higher risk of metabolic syndrome.
- Processed red meat intake—which includes foods like bacon, ham, and pepperoni—was associated with a 48% higher risk of developing metabolic syndrome. Metabolic syndrome is characterized by meeting three or more clinical criteria (see National Institutes of Health definition for more information).
- Poultry intake—such as chicken and turkey—was associated with a 15% lower risk of metabolic syndrome.
Substitution of Unprocessed and Processed Red Meat With Poultry or Fish and Total and Cause-Specific Mortality
- This 2021 study, published in the British Journal of Nutrition, examined the impact of replacing red meat with poultry or fish on mortality risk (21).
- 57,053 adults aged 50–64 years old were enrolled in the study between 1993 and 1997 and followed for an average of 16.1 years.
- Replacing 150 grams of total red meat with 150 grams of poultry modestly lowered mortality risk. However, after adjusting for dietary behaviours like fruit and vegetable intake, the only statistically significant finding—a 5% reduced risk—was for replacing processed red meat with poultry.
Effects of Red Meat, White Meat, and Nonmeat Protein Sources on Atherogenic Lipoprotein Measures in the Context of Low Compared With High Saturated Fat Intake: A Randomized Controlled Trial
- This 2019 randomized controlled trial investigated the effect of protein source—red or white meat—on diets matched for high or low saturated fat in 61 participants (22).
- It found that red meat and white meat had similar effects on increasing LDL cholesterol (LDL-C) and Apolipoprotein B (ApoB), both established cardiovascular risk factors (23, 24).
- However, since the diets were matched for fat levels, the study may not accurately reflect the effect of real-world choices (for example, a high-fat steak vs. a lean chicken breast).
Meta-Analysis of Randomized Controlled Trials of Red Meat Consumption in Comparison With Various Comparison Diets on Cardiovascular Risk Factors
- This 2019 meta-analysis investigated the results of 36 randomized controlled trials involving 1,803 participants (25).
- When poultry replaced red meat, there were no significant changes in cardiovascular markers such as LDL-C and blood pressure.
Poultry and Fish Consumption in Relation to Total Cancer Mortality: A Meta-Analysis of Prospective Studies
- This 2018 meta-analysis reviewed 14 observational studies involving 2,378,204 participants (26).
- There were a total of 96,712 deaths from cancer in the population during the study periods.
- Highest consumers of white meat (poultry) had a 4% lower risk of cancer mortality compared to the lowest consumers.
- In dose-response analysis, each 100-gram per day increase in poultry intake was associated with a 3% lower risk of cancer mortality.
Effect of Red, Processed, and White Meat Consumption on the Risk of Gastric Cancer: An Overall and Dose-Response Meta-Analysis
- This 2019 meta-analysis of 43 observational studies examined gastric cancer risk among red meat, processed meat, and white meat consumers (27).
- When comparing the highest versus lowest intakes, red meat was associated with a 41% higher risk of gastric cancer. Processed meat was linked to a 57% higher risk. In contrast, white meat was associated with a 20% reduced risk.
- Dose-response analysis found that every 100 grams per day increase in red meat was linked to a 72% higher risk of gastric cancer. For processed meat, this increased risk by 86%. However, white meat was linked to a 14% reduced risk per 100-gram increment.
Role of Total, Red, Processed, and White Meat Consumption in Stroke Incidence and Mortality: A Systematic Review and Meta-Analysis of Prospective Cohort Studies
- This 2017 systematic review examined data on the links between meat consumption and stroke incidence from 15 studies involving 741,892 participants (28).
- Findings from the study showed that red meat intake was linked to an 11% higher risk of stroke.
- Processed red meat consumption was associated with a 17% higher risk of stroke.
- However, white meat intake was associated with a 13% lower risk of stroke.
What Do These Studies Show?
Overall, these large cohort and meta-analytic studies indicate that red meat increases the risk of metabolic syndrome, cardiovascular disease, cancer, stroke, and mortality. However, white meat (poultry) typically shows neutral or protective associations.
Public Health Authority Positions on Red and White Meat
Now that we have looked at some recent scientific findings on red and white meat, what do public health authorities advise?
Here is a summary of the advice from reputable public health authorities:
- Dietary Guidelines for Americans: The 2020-2025 Dietary Guidelines for Americans recommends lean meats, citing chicken breast and turkey as examples (29).
- European Food-Based Dietary Guidelines: Recommendations for Meat: Advice from countries within the EU, Iceland, Norway, Switzerland, and the UK recommends limiting red meat, with poultry often recommended as a replacement. Advice ranges from limiting red meat to one serving per week to a maximum recommendation of 500 grams per week, with exact figures varying by country (30).
- World Cancer Research Fund: Advises limiting red meat intake to 12–18 oz (350–500 g) per week. They also suggest potential mechanisms for red meat increasing cancer risk, which includes the formation of compounds linked to cancer when cooking at high heat, and the high presence of heme iron in red meat. They endorse poultry as a valuable protein source (31).
- American Cancer Society: Recommends diets that limit or don’t include red or processed meats. They advise consuming either fish, poultry, or beans rather than red meat (32).
- World Health Organization: Classifies red meat as “probably carcinogenic to humans.” They recognize the nutritional value of red meat, but agree with public health recommendations to limit intake (33).
- National Health Service UK (NHS): Notes that red meat is an excellent source of iron, zinc, and B vitamins but advises limiting red or processed meat to <70 grams per day, based on probable cancer risk (34).
Most public health organizations advise limiting red meat or replacing it with white meat, such as chicken.
Red Meat vs. White Meat: Which Is Healthier?
Proclaiming red or white meat is universally healthier option than the other requires context. For example, red meat may be preferable for an individual with an iron deficiency.
Without individual context, both red and white meat are excellent protein sources that provide key vitamins and minerals.
However, evidence consistently links red meat with higher risks of cardiovascular disease and cancer. These associations are largely absent for white meat like chicken.
Therefore, the advice to limit red meat and more commonly choose white meat is balanced and evidence-based.
Note: “Limit” does not mean “avoid”—it is possible for foods we should “limit” to offer health benefits when consumed within guidance.
For more details, see our in-depth guide: Is Steak a Healthy Choice? An Objective Guide To Red Meat